Yomisola AdegeyeLooking to start your data analytics journey?You can start with TableauSep 9, 2021Sep 9, 2021
Yomisola AdegeyeinThe StartupIt Is Really Getting Hotter and I Have ProofThis blog post explains a short analysis I did about the global temperature trends and temperature changes in Stockholm.Jan 30, 2021Jan 30, 2021
Yomisola AdegeyeinThe StartupHow I Completed a Full Data Analysis Project on House Sale in StockholmRecently, I decided to do a random project and build a proof of concept out of it. I sketched a draft of what processes to follow to…Jan 18, 20211Jan 18, 20211
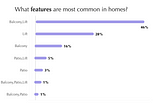
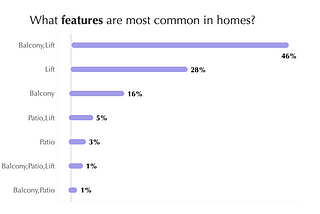
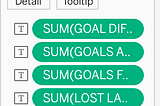
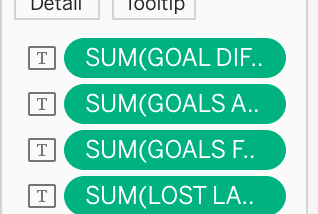
Yomisola AdegeyeHow to use multiple fields as label on a bar chart in tableauRecently, I created a visualization in tableau that uses a bar chart to represent multiple information across several fields. The bar…Dec 26, 2020Dec 26, 2020
Yomisola AdegeyeHaving and Where clause in PostgreSQLThis article explains the difference between the where and Having clause in PostgreSQL . While they both have similar function, they both…Dec 7, 2020Dec 7, 2020
Yomisola AdegeyePostgreSQL Fetch and LimitI recently stumbled on the Fetch clause in PostgreSQL which is functionally the same as the Limit clause, and this short article tries to…Nov 19, 2020Nov 19, 2020
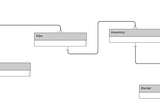
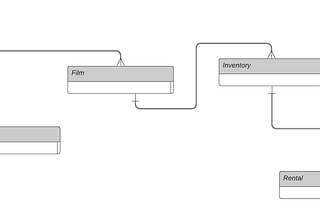
Yomisola AdegeyeEntity Relationship DiagramAn Entity Relationship Diagram(ERD) is a database blueprint that shows us collection of entities and their relationships. It can also be…Nov 11, 2020Nov 11, 2020
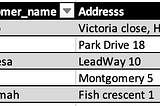
Yomisola AdegeyeAn introduction to SQL JoinsA join in SQL is used to combine columns from one or more tables. It can be used to access information from multiple tables that have…Oct 24, 2020Oct 24, 2020
Yomisola AdegeyeMy first attempt at #MakeOverMondayRecently, I stumbled on MakeOverMonday and their weekly challenge that centers around creating visualizations of data sets that cuts…Aug 31, 2020Aug 31, 2020